Orthodontic Website Speed and Core Web Vitals, Explained
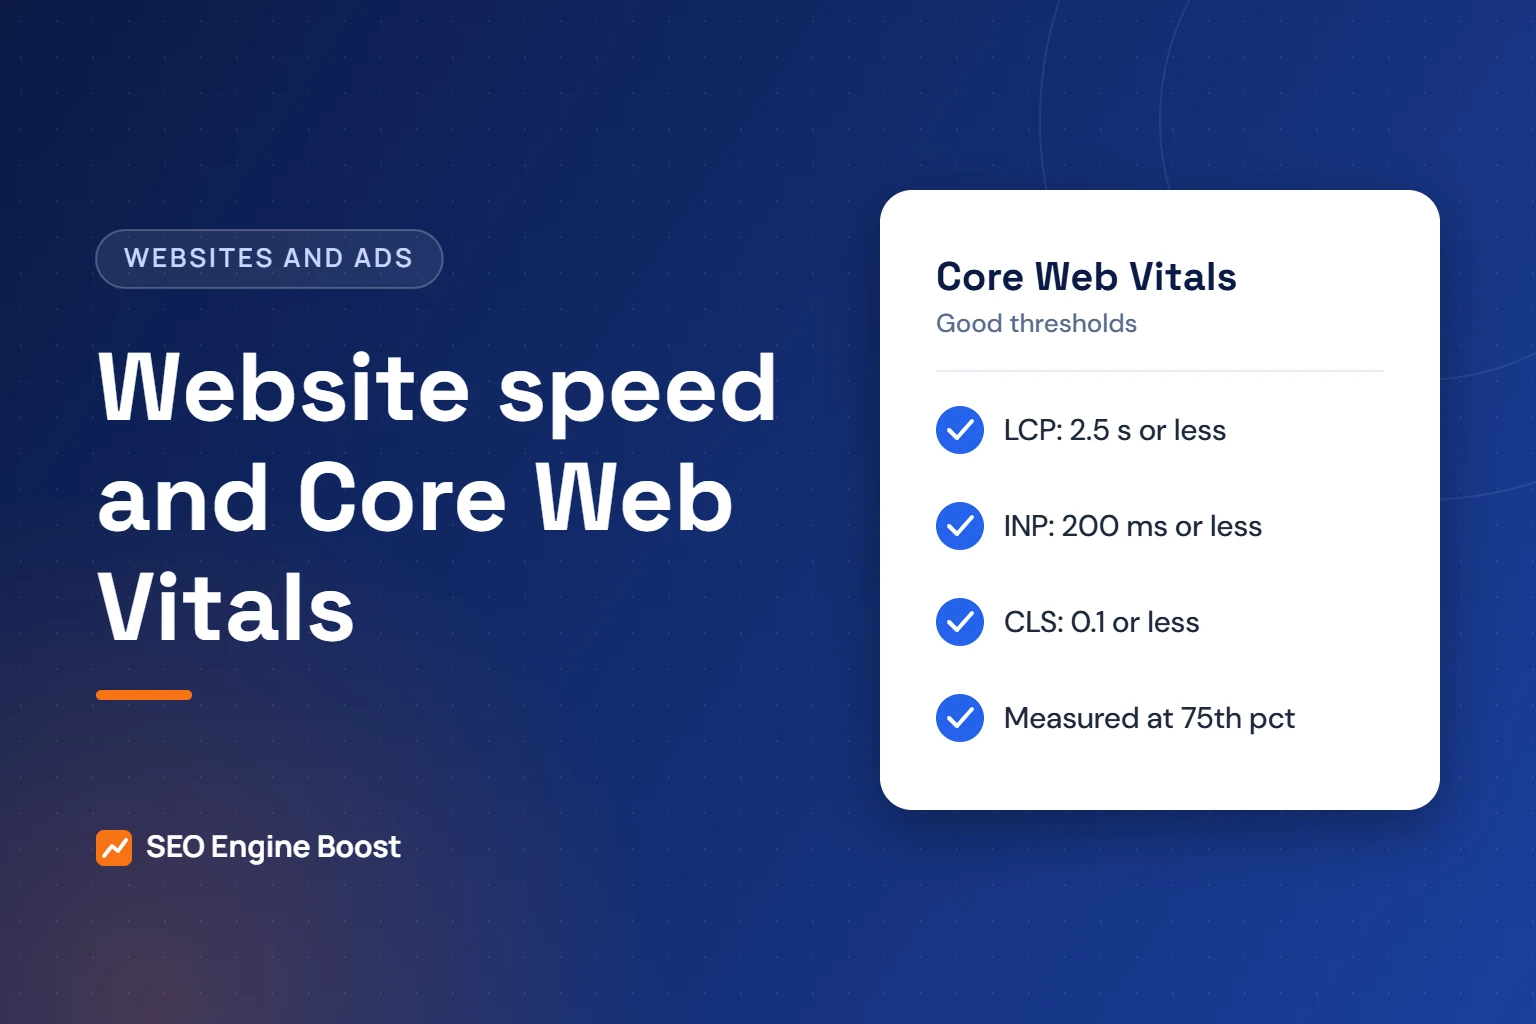
Orthodontic website speed affects how quickly a parent or adult can read your page and request a consultation. Google measures it with three Core Web Vitals. They cover loading (LCP within 2.5 seconds), responsiveness (INP of 200 milliseconds or less) and visual stability (CLS of 0.1 or less).
Google highly recommends good Core Web Vitals for success in Search. This guide explains what each metric means on a practice website, how to test your pages for free and which fixes usually come first. It supports our orthodontic website design service, but every step works on any site.
Key takeaways
- The three Core Web Vitals are LCP, INP and CLS. Google judges them at the 75th percentile of real visits, on mobile and desktop separately.
- Use PageSpeed Insights for real-user field data and Lighthouse lab data. Field data reflects the previous 28 days.
- The biggest early wins on practice sites are usually the hero image, image sizes and layout shifts from widgets and banners.
- Speed supports search and ads, but it does not replace useful, accurate content.
In this article
- What Core Web Vitals measure
- Why speed matters for an orthodontic practice
- How to test your website for free
- Fix slow loading first (LCP)
- Stop the page from jumping (CLS)
- Make taps respond quickly (INP)
- A priority order for practice websites
- Speed, ads and landing pages
- When to fix and when to rebuild
- Frequently asked questions
What Core Web Vitals measure
Core Web Vitals are Google’s three user-experience metrics. Each one has a “good” threshold published on web.dev.
| Metric | What it measures | Good threshold | What it feels like on a practice site |
|---|---|---|---|
| Largest Contentful Paint (LCP) | Loading: when the largest visible element appears | 2.5 seconds or less | How long until the hero photo and headline show up |
| Interaction to Next Paint (INP) | Responsiveness: how fast the page reacts to taps and clicks | 200 milliseconds or less | How quickly the menu opens or the form responds |
| Cumulative Layout Shift (CLS) | Visual stability: how much content jumps around | 0.1 or less | Whether the call button moves just as someone taps it |
web.dev says a good threshold is the 75th percentile of page loads, segmented across mobile and desktop. A page passes when it meets all three targets at that level.
INP became a stable Core Web Vital in 2024, replacing First Input Delay (FID). Older reports and articles may still mention FID.
Why speed matters for an orthodontic practice
People looking for an orthodontist often compare several practices in one sitting. A slow or jumpy page gives them a reason to tap back and choose another result.
- Search: Google says good Core Web Vitals align with what its core ranking systems seek to reward.
- Paid ads: every slow ad page wastes part of a click you already paid for.
- Trust: a page that shifts or freezes feels careless, even when the clinical care is excellent.
Keep speed in perspective. It is one part of page experience. A fast page with thin or inaccurate content will still disappoint. Our guide to common orthodontic website mistakes covers the content side.
How to test your website for free
You do not need paid tools. Two free Google tools give you most of what you need.
- Open PageSpeed Insights and enter your homepage URL.
- Read the field data section first. It shows real-user data from the Chrome User Experience Report.
- Switch between the mobile and desktop tabs. The mobile lab test simulates a mid-tier phone on a mobile network.
- Scroll to the lab data and diagnostics from Lighthouse to find likely causes.
- Repeat for your top treatment pages and your consultation page.
- In Search Console, open the Core Web Vitals report to see which groups of URLs pass or fail.
Which pages to test first
Do not stop at the homepage. Patients often land deeper in the site, especially from ads and maps. Test these pages in this order:
- Ad landing pages, because every visit there was paid for.
- The consultation request or contact page.
- Your main treatment pages, such as braces and clear aligners.
- Location pages, if you have more than one office.
- The homepage.
Field data vs lab data
| Field data | Lab data | |
|---|---|---|
| Source | Real Chrome users, through the Chrome User Experience Report | A simulated page load in Lighthouse |
| Time period | The previous 28-day collection period | A single test run |
| Best for | Knowing whether real visitors have a good experience | Debugging and testing fixes |
| INP | Measured | Not measured; Lighthouse uses Total Blocking Time as a proxy |
| Small sites | May fall back to whole-site data, or show none | Always available |
Small practice sites often lack enough traffic for page-level field data. PageSpeed Insights then falls back to origin-level data, which covers all pages on the site. If the origin also lacks data, no field data appears. In that case, lab data is your main guide.
Lighthouse performance scores of 90 or above are good, 50 to 89 need improvement and below 50 are poor. Treat that score as a debugging aid. The Core Web Vitals pass or fail comes from field data.
Not sure where your practice stands? A free growth audit lists your top three fixes for Google, Maps and AI answers, in writing. Get a free growth audit · See our orthodontic SEO services
Fix slow loading first (LCP)
On many practice homepages, the largest element is a hero photo or video. That makes it the LCP element, and the first thing to fix.
web.dev splits LCP into four parts: time to first byte, resource load delay, resource load duration and element render delay. The fixes below target each part.
- Never lazy-load the hero image. web.dev warns this always adds unnecessary load delay.
- Give the hero image high priority. Use fetchpriority=”high” on that one image, not on many.
- Use modern formats. AVIF or WebP files and good compression shorten download time.
- Size images for phones. Serve smaller files to small screens instead of one huge desktop image.
- Cut redirects. Each redirect adds time before the page even starts loading.
- Improve server response. A high time to first byte can make a 2.5-second LCP hard or impossible.
Autoplay background videos deserve a hard look. If a video is the largest element, it controls LCP. A still photo with a play button is often a better trade.
Stop the page from jumping (CLS)
Layout shifts are the reason someone taps “Call” and hits “Directions” instead. web.dev lists four common causes. All of them show up on practice websites.
| Cause | Where it shows up on practice sites | Fix from web.dev |
|---|---|---|
| Images and video without dimensions | Smile galleries, team photos, embedded videos | Always set width and height, or use CSS aspect-ratio |
| Embeds and iframes without reserved space | Review widgets, maps, booking tools | Reserve space with a min-height or aspect-ratio |
| Web fonts swapping in | Custom brand fonts in headlines | Preload key fonts and choose a close fallback font |
| Content injected late | Cookie banners, promo bars, chat prompts | Reserve space, overlay the content or place it lower on the page |
web.dev notes that late content near the top of the screen causes the largest shifts. A promo bar that drops in above your headline is a classic example.
A simple manual test helps too. Load the page on your own phone over mobile data and watch the call button. If it moves while the page loads, you have a layout shift to fix.
Make taps respond quickly (INP)
INP measures the delay between a tap and the screen updating. Slow INP usually comes from too much JavaScript running at once.
- Break up long tasks. web.dev recommends splitting heavy work so it does not block the main thread.
- Do less in event handlers. Menus and form buttons should update the screen first and do extra work after.
- Keep the page structure lean. web.dev notes that rendering usually finishes quickly when the DOM is small.
- Audit your add-ons. Each chat widget, review feed, tracker and slider adds script work. Remove the ones nobody uses.
Page builders and heavy themes can add a lot of script. If a site needs many plugins to do simple things, that cost shows up in INP.
Want to know what is slowing your site down?
Dr. Mahmoud Elsheikh reviews your speed data and priorities himself, and your practice keeps ownership of the website.
A priority order for practice websites
As agency guidance, this order fixes the most visible problems with the least disruption. Adjust it to what your own field data shows.
| Priority | Fix | Typical effort | Main metric |
|---|---|---|---|
| 1 | Compress and resize the hero image; remove lazy loading from it | Low | LCP |
| 2 | Add width and height to all images and embeds | Low | CLS |
| 3 | Reserve space for banners, review widgets and maps | Low to medium | CLS |
| 4 | Remove unused plugins, widgets and tracking scripts | Medium | INP and LCP |
| 5 | Replace autoplay hero video with a still image | Medium | LCP |
| 6 | Improve hosting, caching and redirects | Medium to high | LCP |
| 7 | Rebuild on a lighter theme or framework | High | All three |
Re-test after each change. Field data covers the previous 28 days, so fixes take time to show there. Use lab data for quick confirmation. Ask whoever makes the change to save before and after PageSpeed Insights results, so you have a record.
Speed, ads and landing pages
Paid traffic magnifies speed problems. Every visitor from an ad cost money before the page even loaded.
Ad landing pages should be the fastest pages on your site. Keep them light: one hero image, a short form and no autoplay video. Our guide to orthodontic ad landing pages lists the other elements those pages need.
Speed and accessibility also overlap. Stable layouts and responsive buttons help everyone. Our guide to orthodontic website accessibility covers the rest.
When to fix and when to rebuild
Most speed problems can be fixed without a new website. Rebuilding makes sense when the platform itself is the bottleneck.
- Fix when problems trace to images, widgets or a few heavy plugins.
- Fix when field data is close to the thresholds and improving.
- Consider a rebuild when the theme or builder adds heavy script to every page.
- Consider a rebuild when you cannot edit image sizes or remove scripts without vendor help.
Before any rebuild, confirm you own the domain, hosting and content. Our guide to owning your practice website explains what to check.
Frequently asked questions
What is a good page speed for an orthodontic website?
Use Google’s Core Web Vitals thresholds. Largest Contentful Paint should be 2.5 seconds or less. Interaction to Next Paint should be 200 milliseconds or less. Cumulative Layout Shift should be 0.1 or less. Google assesses these at the 75th percentile of real visits, separately for mobile and desktop.
Why does PageSpeed Insights show no field data for my site?
Field data comes from real Chrome users. Small practice sites often lack enough visits for page-level data. PageSpeed Insights then falls back to data for the whole site. If the site also lacks enough data, no field data appears. Use the lab data and Lighthouse diagnostics to guide fixes until traffic grows.
Does website speed affect Google rankings for orthodontists?
Google says good Core Web Vitals align with what its core ranking systems seek to reward, and it highly recommends achieving them. Speed is one part of page experience, not the whole picture. Relevant, accurate and helpful content still matters. Treat speed as a requirement, not a shortcut to the top.
Why is my Lighthouse score different every time I test?
Lab tests run a single simulated load, so network and server conditions vary between runs. Treat the score as a debugging aid. The Core Web Vitals assessment that matters comes from field data over the previous 28 days. Run several lab tests and look at the trend rather than one result.
Is FID still a Core Web Vital?
No. Interaction to Next Paint (INP) became a stable Core Web Vital in 2024 and replaced First Input Delay (FID). INP measures how quickly the page responds to taps and clicks. If an older report or plugin still shows FID, check your site in a current tool such as PageSpeed Insights instead.
Sources
- web.dev: Web Vitals (updated Oct 31, 2024)
- web.dev: Optimize Interaction to Next Paint (updated Sep 2, 2025)
- Google Search Central: Understanding Core Web Vitals and Google search results (updated Dec 10, 2025)
- Google for Developers: About PageSpeed Insights (updated Oct 21, 2024)
- web.dev: Optimize Largest Contentful Paint (updated Mar 31, 2025)
- web.dev: Optimize Cumulative Layout Shift (updated Feb 7, 2025)
Keep reading
See where your practice stands
If you would like a second pair of eyes on your own practice, we offer a free growth audit: a manual review of your local visibility, website, reviews and content, with a prioritized list of what to fix first.